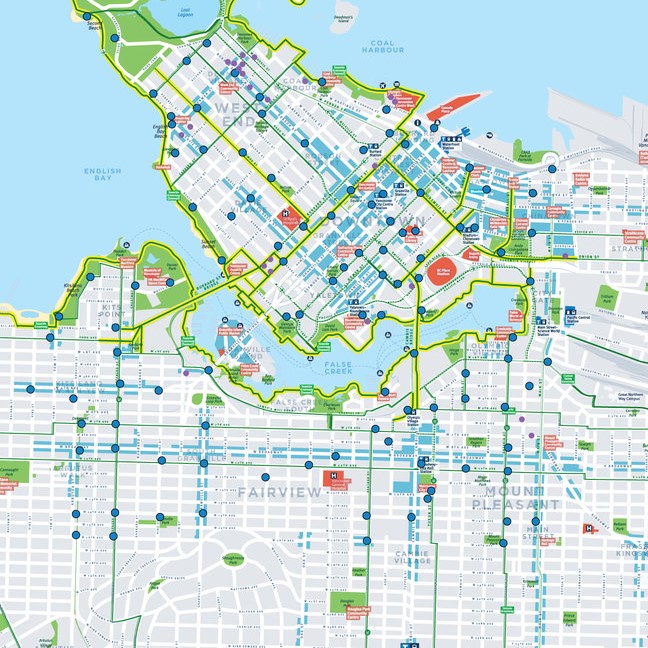
Mapping Bikeability
Current travel demand models are calibrated for motorized transportation, and perform less well for non-motorized modes. Little evidence exists on how much, and for what reasons, the routes people actually travel deviate from shortest-path or least-cost routes generated by transportation models. The purpose of this study was to identify factors to be considered in travel models when modeling travel by bicycle, making comparisons to motorist travel. We investigated differences in total distance, road type used, and built environment features along the shortest distance routes and the actual routes for car and bicycle trips in an urban area with extensive bicycle facilities, the Metro Vancouver region. The study captures travel behaviors in a population-based
sample of cyclists, including potential, infrequent, and regular cyclists, a population purposefully selected based on Stages of Change Theory from health promotion.
This study aimed to understand which features of the built environment influence people’s choices to cycle in the Metro Vancouver context.
METHODS
The study used three methods to understand which features of the built environment influence people’s choices to cycle:
- An opinion survey asked about preferred cycling route types. 2,149 adults in the Greater Vancouver region completed a telephone interview in which they reported their origins, destinations, and modes of travel for weekly trips. We linked this trip data to mapped data on population, land use, topography, and the transportation network. This included using Geographic Information Systems (GIS) to map trips, generate travel routes, and develop measures of the built environment. The linked data was then analyzed to determine which objective factors influence choice of cycling as the mode of transport.
- Focus groups of different types of cyclists. We interviewed 74 cyclists about their cycling and driving trips, and compared features of the shortest routes between the start and end of their trips, and the route that was actually taken.
- Mapping.
FINDINGS
Our analysis showed that cyclists do deviate from shortest routes in order to take routes with better bicycle facilities (including traffic calming features, bike stencils, and signage). Population density, air pollution, hilliness, land use, and green cover along the route were not different between the actual routes travelled and the shortest routes.
Although we found that cyclists do detour from the shortest path route, this deviation was limited: on average, cyclists detoured 400 meters (about 2 city blocks). Three-quarters of the trips in our study were less than 10% longer than the shortest route between the origin and the destination.
Detour rates were similar by mode: three-quarters of trips were less than 10% longer than the shortest distance route. But the motivations for detouring differed. Bicycle trips were more likely to be along routes with better bicycle facilities and away from major roads. Car trips, conversely, were more likely to be along highways and arterials.
Links between cycling & the built environment
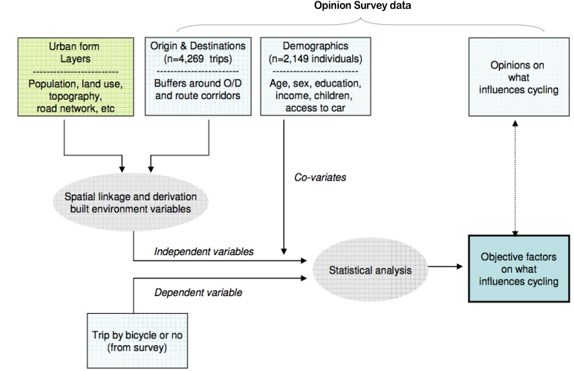
This work identified features of the built environment associated with a higher likelihood of cycling, versus driving. It applied a novel spatial approach, measuring features of the trip origin, destination, and the route between them, and adjusted for personal characteristics and trip distance. The results indicate that the built environment is associated with mode choice and specifically that urban form is important not only at the trip origin, but also along the route and around the destination.
Bikeability Index
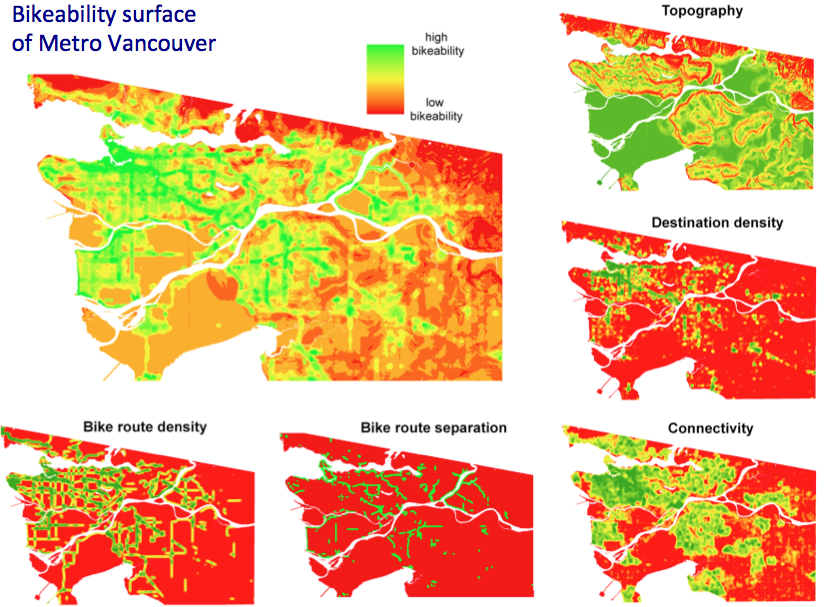
We created a bikeability index, based on 5 components identified in our opinion survey as important to cyclists, then explored in focus groups and validated by the travel behavior mapped analysis. These components are:
- bicycle route density
- bicycle route separation
- connectivity of bicycle-friendly streets
- topography
- destination density
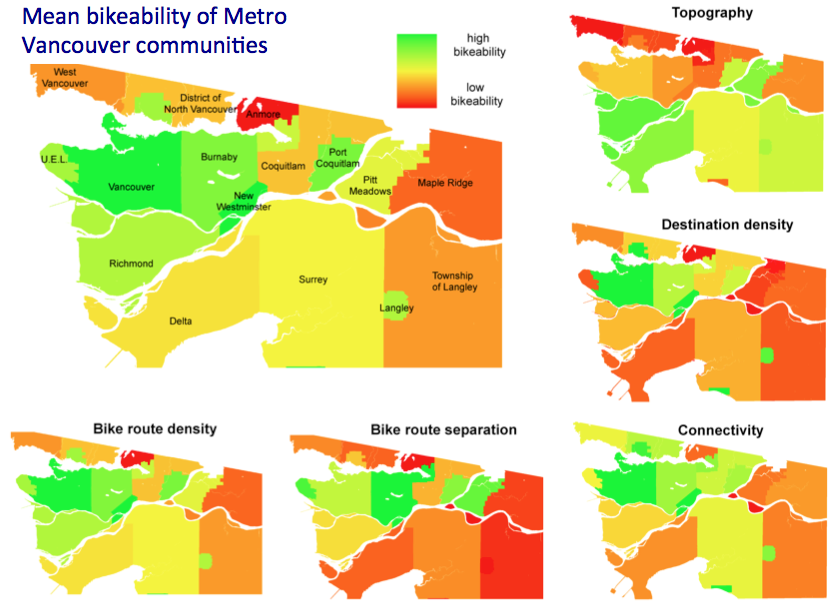
We used the index to create bikeability maps that identify areas more and less conducive to cycling, using Metro Vancouver as a case study . Because we mapped bikeability as a continuous surface, the index can be scaled (city versus region) or aggregated (to compare municipalities or neighbourhoods), as shown below.
These maps can be used to guide local strategies to improve cycling conditions.
KNOWLEDGE PRODUCTS
- How far cyclists are willing to detour for cycling-specific infrastructure. [Research Brief]
- Winters, M., Brauer, M., Setton, E. M., & Teschke, K. (2010). Built environment influences on healthy transportation choices: bicycling versus driving. Journal of Urban Health, 87(6), 969-993. [article]
- Winters, M., Brauer, M., Setton, E. M., & Teschke, K. (2013). Mapping bikeability: a spatial tool to support sustainable travel. Environment and Planning B: Planning and Design, 40(5), 865-883. [article]
- Winters, M., Teschke, K., Grant, M., Setton, E. M., & Brauer, M. (2010). How far out of the way will we travel? Built environment influences on route selection for bicycle and car travel. Transportation Research Record, 2190(1), 1-10. [article]
- “A “Bikeability” Planning Tool” , North American Congress of Epidemiology, Montreal, June 2011. [poster]
- How far out of the way will we travel? Transportation Research Board, Washington DC, January 2010. [poster]
- “A web-based bicycle trip planning tool”- developed by our team (many features have now been incorporated into Google Maps) Velo-city, Brussels, 2009. [poster]
- “Using GIS to characterize urban form and bikeability”, ProWalk ProBike , Seattle, September 2-5, 2008. [poster]
- Results of focus groups- “What Makes a Neighborhood Bikeable”, conducted in conjunction with TransLink. [Report] and [Poster]
- [The Vancouver Bike Route Planner] select safer bike routes, based on evidence from our cycling safety study. Thank you to Melissa Nunes (@topophilo) for her work on this.
FUNDERS & PARTERS
Funded by the Heart and Stroke Foundation of Canada and the Canadian Institutes of Health Research in 2007.

