Preferred Route Types and Other Motivators and Deterrents for Cycling
Using a bicycle for transportation is good for the environment, and it also offers personal health benefits. Cycling is also feasible, since more than 80% of Canadians live relatively close to at least one common destination, and over half of us already own
a bicycle. Despite these advantages, however, cycling rates in Canadian cities remain very low. This study aimed to investigate what types of routes people prefer to cycle on, as well as the motivators and deterrents of cycling, and was a sub-study of a larger study, Mapping Bikeability.
METHODS
In 2006, an opinion survey (distributed by mail and online) asked 1,402 adults in Vancouver (Canada) about factors that might influence their likelihood of cycling. The survey targeted those who currently cycled (regularly to occasionally) or who were in the “near market” for cycling (i.e. would be interested in cycling but currently do not). Three photos each of 16 route types were presented and participants were asked to rate each on a scale of -1=”very unlikely to choose” to +1=”very likely to choose”. In addition, 73 features that might affect cycling were presented (derived from an extensive review of the scientific and grey literatures).
Focus groups sought additional detail about the reasoning behind people’s preferences found in the survey.
FINDINGS
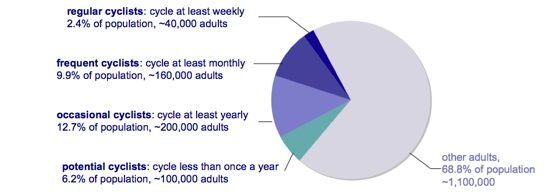
Survey participants represented about 31% of adults in the region (~500,000 people).

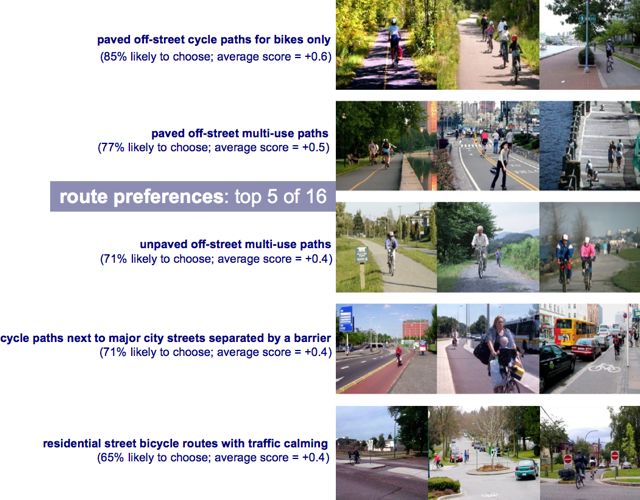
Of the 16 route types, 5 route types (pictured below) were the most preferred.

Of the 73 features that might affect cycling presented top motivators and deterrents to cycling were as follows:
| TOP MOTIVATORS (features that encourage cycling) | TOP DETERRENTS (features that discourage cycling) |
| 1. cycling routes away from traffic and noise 2. near beautiful scenery 3. separated from heavy and high speed traffic 4. with minimum slopes and distances 5. with smooth, non-slip surfaces clear of debris 6. good lighting 7. lanes marked with reflective paint 8. safe indoor bike storage 9. the option to take bikes on transit | 1. the route is snowy or icy 2. the street has a lot of car, bus, or truck traffic 3. the route has glass or debris 4. vehicles drive faster than 50 km/h 5. the risk from motorists who don’t know how to drive safely near bicycles 6. the risk of injury from car-bike collisions 7. it is raining 8. the route has surfaces that can be slick when wet or icy when cold 9. the route is not well lit after dark 10. I need to carry bulky or heavy items |
Route Use vs. Route Preference
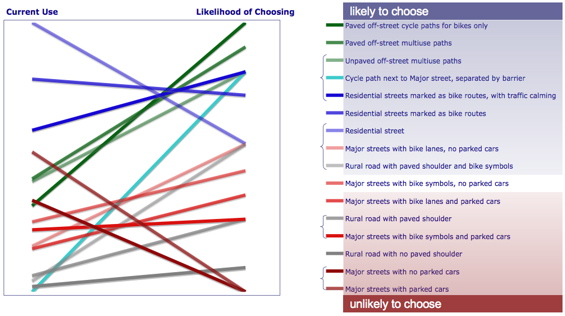
The following figure shows all 16 route types in order of preference (highest to lowest) “likelihood of choosing” as well as order of current use. The fact that the lines cross so much indicates that the routes that people prefer to cycle are less available. For example “major streets with parked cars,” without any bike infrastructure, are the least preferred, but used quite often because they are available. In contrast, “cycle paths next to a major street, separated by a barrier” were rarely used because they are uncommon in this region, but tie as third most preferred route type.

Preferred Route Types, by Cyclist Type
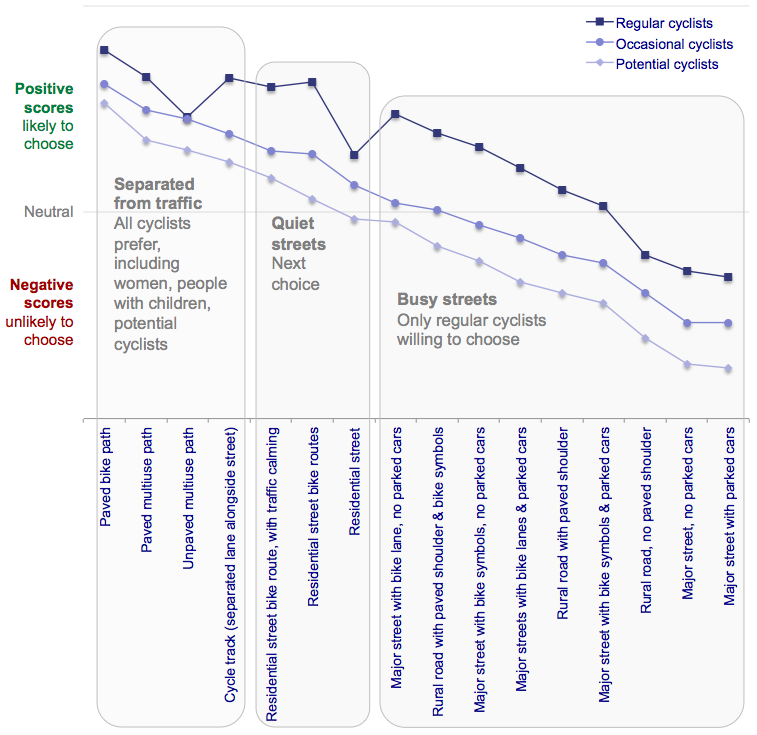
The figure below shows the likelihood of choosing the route types in a slightly different way – the average score for each route type, for each of three types of cyclist: regular (including frequent), occasional and potential. It shows that the order of route preference varied little across types of cyclists, except that those who cycle regularly ranked unpaved off-street paths and residential streets without bicycle features lower than other cyclist groups. The opinions of this group may reflect the future opinions of others as they cycle more often, so these two route types might be considered less important in route development.
Overall scores of all route types were highest for regular cyclists, then occasional cyclists, and finally potential cyclists. Women and people with children scored routes similarly to occasional and potential cyclists, that is, only routes separated from traffic or on quiet streets received positive average scores. This evidence suggests that to motivate people who cycle least often, the most desirable routes – those separated from traffic – should be the focus of development.

KNOWLEDGE PRODUCTS
- [Brochure] summarizing the results of the opinion survey.
- [Short report] evaluating bicycle facilities prepared for a meeting Vancouver City Councillors and Bicycle Advisory Committee, February 2009.
- [Poster] “Designing Cycling for Cities” at ProWalk ProBike Conference, Seattle, September, 2008.
- [Report] and [Poster] “What Makes a Neighbourhood Bikeable“ focus groups results.
- Winters M, Teschke K. (2010). Route preferences among adults in the near market for cycling: Findings of the Cycling in Cities Study. American Journal of Health Promotion;25:40-47 [article]
- Winters M, Davidson G, Kao D, Teschke K. (2011). Motivators and deterrents of bicycling: comparing influences on decisions to ride. Transportation;38:153-168 [article]
PARTNERS & FUNDERS
- Metro Vancouver & municipalities
- Transport Canada
- TransLink
